01. Discover
What is the Toxicity Module?

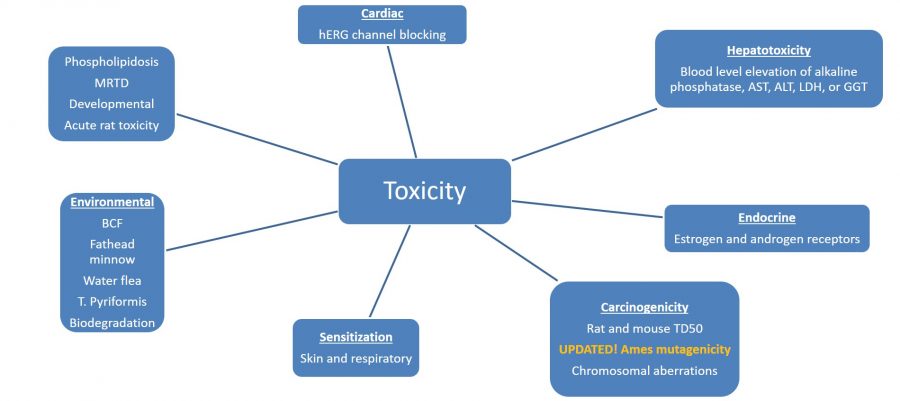
No early compound candidate screening tool should neglect toxicity aspects. Living up to its name, ADMET Predictor® features a rapidly growing array of toxicity prediction models. The module features models covering a large range of  toxicities included cardiac, hepatotoxicity, endocrine, carcinogenicity, sensitivity and environmental.

The models below were rebuilt in ADMET Predictor version X.4 to improve their confidence prediction estimations:

  • Maximum recommended therapeutic dose (MaxRTD)
  • Estrogen (Estro_Filter) and androgen (Andro_Filter) binding
  • Skin sensitivity (Sens_Skin)
  • Respiratory sensitivity (Sens_Resp)
  • Biodegradation (Biodegradn)
  • hERG binding (hERG_Filter)
  • Chromosomal aberations (Chrom_Aberr)
  • Phospholipidosis (PLipidosis)
  • Reproductive toxicity (Repro_Tox)
  • Five liver enzyme elevation models (Ser_AlkPhos, Ser_GGT, Ser_LDH, Ser_AST, and Ser_ALT)
02. Explore
Additional details for each model:
  • Models in the Toxicity Module

    The image on the left lists the models in ADMET Predictor’s Toxicity Module.  The Ames mutagenicity models were updated in ADMET Predictor version 8.5.  The confidence estimation algorithm estimates the positive and negative confidences separately rather than considering the whole data set.  This yields more accurate estimates of predictive uncertainty for unbalanced data sets.

  • Cardiac Toxicity - Affinity towards hERG-Encoded Potassium Channels

    ADMET Predictor assesses each compound for inhibitory affinity towards hERG-encoded K+ channels, which are responsible for the normal repolarization of the cardiac action potential. Blockage or any other impairment of these channels in the heart cells can lead to fatal cardiac toxicity. Two neural network models, classification and regression, are used to assess a compound’s likelihood of blocking to the hERG channel.

    TOX_hERG_Filter

    The first hERG model is a classification model that predicts whether the compound will have affinity for the hERG K+ channel. Compounds with a hERG IC50 less than or equal to 10 µM were labeled “Yes”, while those greater than 10 µM are considered “No”. A “Yes” prediction indicates that a compound is likely to block to the hERG channel. These compounds should then be assessed in the hERG regression model, below, l in order to quantify their inhibitory activity.  Classification models based on the threshold of IC50 equal to 1 µM were also investigated, however the data set for the model with a threshold IC50 = 10 µM had a better balance between Yes: No compounds.  The table below shows the performance statistics of the model.

    performance of the tox herg

    Performance statistics of the TOX_hERG_Filter model.

    TOX_hERG

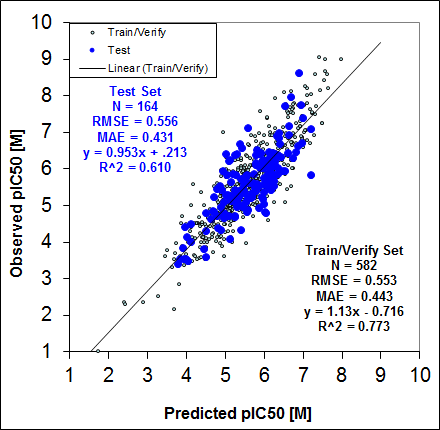
    The hERG affinity model, labeled TOX_hERG, is an artificial neural network ensemble model trained on pIC50 (-log(IC50 [M]) values for inhibition of hERG K+ channels derived from the literature. Only mammalian cell lines were considered with the vast majority of measurements being made on human embryonic kidney [HEK] and Chinese hamster ovary [CHO] cells stably transfected with hERG.

    The model predicts the IC50 value of a particular compound in molar units, and reports them as pIC50. Similar models were built using individual cell lines and combinations thereof, however this model consisting of a combination of all the mammalian cell lines performed the best when evaluated against an external proprietary test set from a major pharmaceutical company containing over 300 compounds.  The model’s performance is shown on the left.

    experimental vs practiced liver test results

    Experimental vs. predicted pIC50 values for inhibition of hERG K+ channels. The blue dots denote predictions for the external test.

  • Human Liver Adverse Effects

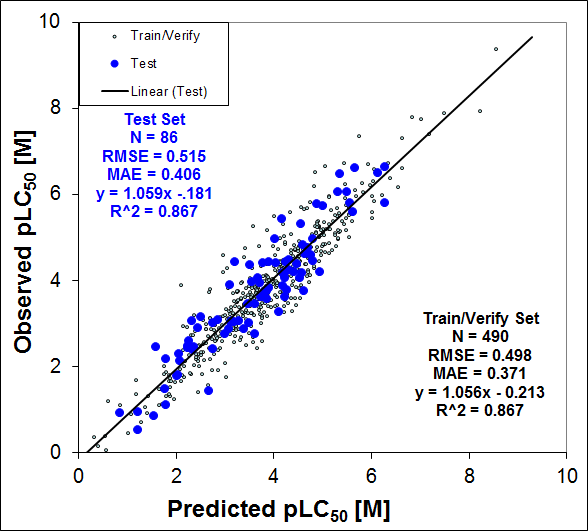
    The US Food and Drug Administration’s Center for Drug Evaluation and Research has been collecting reports on human liver adverse effects of drugs since 1968. Two databases resulted from this work; the Spontaneous Reporting System (SRS) and the Adverse Event Reporting System (AERS). ADMET Predictor uses a subset of 490 compounds from a publicly available (non-proprietary) SRS database, gathered 1978 – 1996, to model hepatotoxicity of many popular pharmaceuticals. The reports were collected for up to a five year period for each compound in the study.

    ADMET Predictor Hepatic Toxicity Models Validation

    ADMET Predictor Hepatic Toxicity Models Validation

    Modeling Adverse Drug Reaction (ADR) effect is a challenging task because of the uniqueness of this type of data. The number of ADR reports for individual drugs varies and is dependent on the length of time the drug was marketed and the number of patients taking the medication. Some effects are underestimated due to insufficient data. Furthermore, several medications taken simultaneously by a patient make it sometimes difficult to identify which drug mostly attributed to the adverse effect.

    To make the data more comparable, each data point in the model database accounts for the volume of the pharmaceutical product in the form of a shipping unit. The ADR report data and the pharmaceutical shipping values are used to estimate pharmaceutical usage and human exposure by calculating the Reporting Index (RI = (# ADR reports / # shipping units) × 1,000,000).

    The SRS dataset differentiates between 3 classes of compounds: active (RI < 3.0), marginally active (3.0 < RI < 4.0) and inactive (RI > 4.0). The neural network ensemble models employed in ADMET Predictor treat marginally active (marginally toxic) compounds as active (toxic) by setting the RI cutoff value to 3.0. Therefore, molecules with RI < 3.0 are classified as inactive (nontoxic) and those with RI > 3.0 as active. ADMET Predictor offers 5 individual models corresponding to individual enzymes used in hepatotoxicity diagnostics:

    1. Alkaline Phosphatase increase
    2. SGOT increase
    3. SGPT increase
    4. LDH increase
    5. GGT increase.
  • Chronic Carcinogenicity and Mutagenicity

    ADMET Predictor’s chronic carcinogenicity and mutagenicity models are built using data from the Carcinogenic Potency Database (CPDB). The CPDB is a curated archive of compound names and tumorigenesis data that is available through the Environmental Protection Agency’s DSSTox program. As noted by the DSSTox program staff, the CPDB “includes detailed results and analyses of more than 5000 chronic, long term carcinogenesis bioassays reported in over 1200 papers in the general literature and more than 400 Technical Reports of the National Cancer Institute/National Toxicology Program”.

    Two quantitative carcinogenicity models based on this data are available in ADMET Predictor. The first of these, TOX_BRM_Rat, predicts the TD50 value of a particular compound in units of mg/kg/day. The TD50 is the dose of a substance administered orally to rats over the course of their lifetimes that results in the appearance of tumors in 50 percent of their population. Likewise, the second carcinogenicity model, TOX_BRM_Mouse, predicts the TD50 value in mice (same units).

    The carcinogenicity panel also features a series of 10 models assessing Ames Mutagenicity in 5 individual strains of Salmonella with or without metabolic activation. The Ames Mutagenicity is a measurement of the mutagenic potential of chemical compounds developed by Bruce Ames and his group with the use of strains of the Salmonella typhimurium as an alternative to testing in rodents, which takes longer and costs more.

    The ten TOX_MUT* Artificial Neural Network Ensembles are qualitative models, predicting the mutagenicity of new compounds as “Positive” (i.e., mutagenic) or “Negative”. We also created an ADMET Risk™ rule file called TOX_MUT_Risk which predicts overall mutagenicity by counting instances of “Positive”.

  • Chromosomal Abberations

    Another aspect of related toxicity are chromosomal aberrations (CA) – such a test is frequently used for the assessment of the in vitro genotoxic potential of chemicals and drugs. Typically, compounds are examined with and without a mammalian metabolizing system containing liver microsomes to see if they induce structural chromosome aberrations in cultured cells.

    ADMET Predictor provides a neural net ensemble model, TOX_CABR, to classify whether chemicals or drugs may cause a chromosome aberration from their 2D structures. A data set with observed CA results were collected from literatures, with a very balanced distribution of “Toxic” and “Nontoxic”‘. The model’s prediction accuracy is illustrated.

  • Maximum Recommended Therapeutic Dose

    Towards the goal of better understanding the relationship between structure, toxicity, and no-effect level (NOEL), the US Food and Drug Administration’s Center for Drug Evaluation and Research has compiled a database of maximum recommended therapeutic dose (MRTD). The details of the work and the non-proprietary part of the database were published by the Informatics and Computational Safety Analysis Staff (ICSAS) under the authorship of Contrera, et al. (Matthews; 2004).

    ADMET Predictor employs neural net ensemble models to predict the MRTD value for both 2D and 3D representations of molecules. The units of the result are in mg/kg of body weight/day. Interpretive cutoff value for the model, 3.16 mg/kg/day is approximately equal to the log-mean of values used by Contrera et al. Predictions lower than 3.16 mg/kg-bw/day indicate an “active” compound with significant potential for side effects. Predictions higher than 3.16 mg/kg-bw/day indicate an “inactive” compound for which side effects are less likely.

  • Acute Rat Toxicity

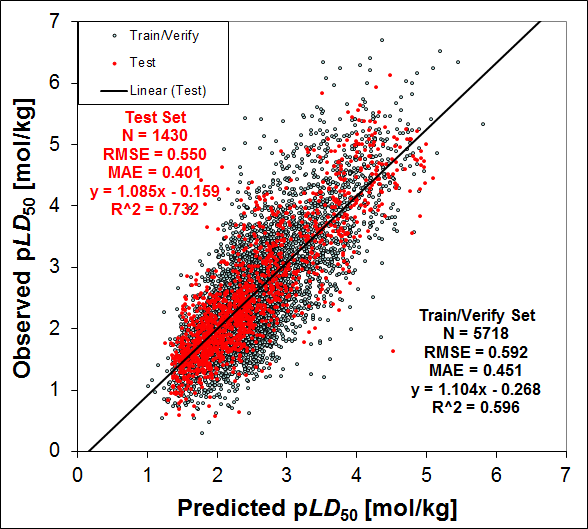
    The acute rat toxicity model is based on the amount of an orally administered chemical in mg/kg body weight that produced lethality in 50% of the rats in each respective study regardless of the mode of action. Such a diverse data set poses, therefore, an extreme challenge to a QSTR modeler.

    Data for this study comes from two sources, the highly overlapping RTECS, Registry of Toxic Effects of Chemical Substances, data set (the version previously owned by the Center for Disease Control’s National Institute for Occupational Safety and Health) and the ChemIDplus database. A unique subset of compounds were selected and used to model the endpoint pLD50. In both 2D and 3D models greater than or equal to 20% of the data were set aside for the external test sets prior to training the models.

    ADMET Predictor 3D TOX_RAT Model Validation

    ADMET Predictor 3D TOX_RAT Model Validation

  • Phospholipidosis

    Phospholipidosis is a lysosomal storage disorder characterized by the accumulation of phospholipids in the tissues of the body. Lysosomes are cellular organelles containing enzymes which metabolize waste materials to facilitate their excretion. In individuals with lysosomal storage disorders, materials that are normally metabolized by the lysosomes become trapped in the cells. While metabolic disorders can be hereditary, they can also be drug induced, as is the case with phospholipidosis.

    A variety of classes of drugs can induce phospholipidosis and despite numerous studies, the mechanism through which phospholipidosis occurs is not fully understood. Phospholipidosis is considered to be particularly important in the context of the nervous system, where the presence of phospholipids may disrupt neuronal cell signaling and may be linked to genetic diseases such as Niemann-Pick disease. The identification of phospholipidosis can delay or halt drug development, as extra testing may be necessary to meet the requirements of regulators.

    A data set of chemicals with a known phospholipidosis profile was taken from literature and used to build a classification model named TOX_PHOS. All non-inducers and some inducers were identified by electron microscopy, while the remaining inducers were identified due to the presence of foamy macrophages or vacuolations. Non-inducers are labeled ‘Nontoxic’, while inducers are labeled ‘Toxic’.

    Validation and performance of the 2D model of phospholipidosis

  • Skin and Respiratory Sensitization

    A skin sensitizer is a compound or substance that induces cutaneous allergic reactions. During the past decade the murine local lymph node assay (LLNA) has proven to be a useful tool in assessing the relative potency of compounds as skin sensitizers for risk assessment purposes and it has been recently recommended as a validated method for the determination of the relative potency of skin sensitizing chemicals. Details regarding LLNA standards and applicability domain can be found on the National Toxicology Program’s website.


    TOX_SKIN

    ADMET Predictor 2D and 3D TOX_SKIN Model Validation – See more at:


    Performance of the 2D version of the TOX_RESP model.

    Performance of the 2D version of the TOX_RESP model.


    The endpoint of the LLNA is the EC3, the estimated concentration of a chemical required to produce a 3-fold stimulation of draining lymph node cell proliferation in mice compared with concurrent controls is used to divide compounds into classes of sensitizers and non-sensitizers. Compounds with an EC3 less than or equal to 10% are considered sensitizers and those greater than 10% are non-sensitizers. The literature data was significantly skewed (80%) toward sensitizing compounds, several known drugs and other compounds known not to have any issues with cutaneous or other allergies were included to balance the data set. High concordance on the external test sets are exhibited by both 2D and 3D models; see the table on the left.

    The AOEC has published more up to date definitions inclusive of respiratory sensitizers and identified a list of over 400 asthmagens. Asthmagens are broken down into classes: sensitizer-induced asthma, substances inducing reactive airway dysfunction syndrome (RADS), substances that meet both criteria, those that meet neither criteria, and generally accepted substances. In total, a data set consisting of 193 non- and 117 respiratory sensitizers was curated from the aforementioned source.

    Another aspect of allergenic reactions to drugs, addressed by our TOX_RESP model, is respiratory sensitization. A data set of 80 compounds has commonly been used to model this endpoint. It consists of 40 sensitizers identified through inhalation studies in rats and 40 of 118 non-sensitizers which were selected from non-skin sensitizing agents. The data set, however, was broadened with compounds from The Association of Occupational and Environmental Clinics (AOEC) and supplemented with known drugs and excipients, which are generally accepted not to be respiratory sensitizers as they are components of inhaled drugs for respiratory disorders.

  • Endocrine Toxicity

    Disruptions in endocrine system signaling can result from the interaction of drug compounds with the active site of the estrogen and/or androgen receptors. There, the compounds compete for binding with a sex hormone; the natural substrate for the receptor, blocking the transmission of normal hormonal signals and inducing toxicity. For example, androgens play a critical role in the development and maintenance of the male phenotype, as well as in the pathology and treatment of prostate cancer.

    Tox ER

    ADMET Predictor TOX_ER_filter Model Validation


    Two neural network ensemble models are used to assess a compound’s likelihood of binding to the estrogen receptor. The first is a straightforward prediction of whether the molecule will have a detectable affinity for the receptor at all. The results for this “filter” model appear in the column labeled TOX_ER_Filter. A result of “Nontoxic” indicates that the compound is unlikely to cause endocrine toxicity by binding to the receptor. A result of “Toxic” indicates only that the compound is likely to bind detectably to the receptor – the degree of toxicity is not specified.

    ADMET Predictor 3D TOX_ER Model Validation

    ADMET Predictor 3D TOX_ER Model Validation


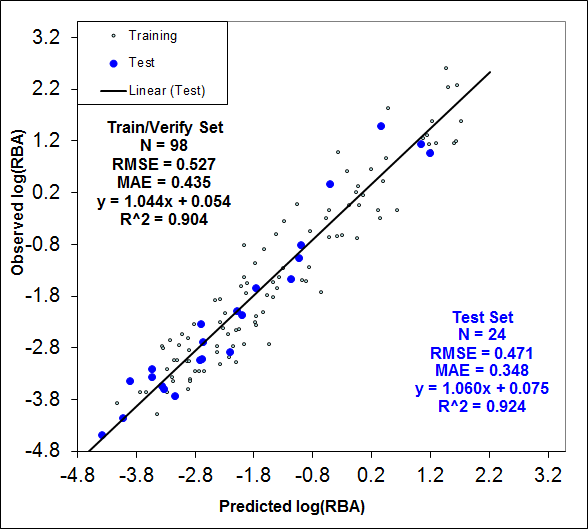
    The second model predicts the degree of binding for those compounds that are identified by the filter as “Toxic”. This model appears under the column called TOX_ER and displays the relative binding affinity (%RBA) of a molecule determined by a competitive binding assay. The RBA is a dimensionless number expressed as the percent ratio : 100% * (IC50 for 17 ß-estradiol / IC50 for the drug in question). Higher values indicate greater binding affinity and likelihood for endocrine-related toxicity.

    TOX_AR_filter

    ADMET Predictor TOX_AR_filter Model Validation


    Likewise, two neural network ensemble models were built for the androgen receptor: qualitative TOX_AR_Filter (“Toxic”/”Nontoxic”) and quantitative TOX_AR. Unlike the corresponding ER models referenced by a natural estrogen, the reference ligand here was 17R-methyl-[3H]-methyltrienolone (R1881); a synthetic substrate which binds more strongly than testosterone. The binary classification of TOX_AR_Filter was based on the LC25 value of R1881 displacement assay. Compounds with LC25 less than or equal to 10 µmol/L were labeled “Toxic” (likely to bind) while those greater than 10 µmol/L are considered “Nontoxic” (Vinggaard; 2008).

    The TOX_AR model predicts the degree of binding for those compounds that are identified by the filter as “Toxic”. In this case IC50 measurements were used from R1881 displacement assays (Fang; 2003). The %RBA is defined in a way analogous to TOX_ER.

  • Reproductive Toxicity

    Reproductive toxicity is an important regulatory endpoint. It has been used synonymously with developmental toxicity. The terminology ‘reproductive toxicity’ relates to anything that disturbs the reproductive process of organisms, including adverse effects to sexual organs, behavior, ease of conception, and developmental toxicity of offspring both before and after birth. According to the European Union’s REACH (Registration, Evaluation and Authorization of Chemicals) legislation, screening tests (OECD TGs 421 or 422) for reproductive/developmental toxicity is required for substances produced or imported in quantities between 10 and 100 tons per year. Other tests are usually required for substances produced or imported in quantities greater than or equal to 100 tons per year.

    Data for our TOX_REPR model originates from the FDA/TETRIS database and was obtained through literature. The database was constructed by researchers for the Department of Environmental and Occupational Health at the University of Pittsburg and it combines subsets of information from the Teratogen Information System (TERIS) guidelines set forth by the Food and Drug Administration (FDA). Structures were available for 292 of the 293 compounds of which 116 were considered to be toxic. This classification model approaches 90% overall concordance.

    Performance of the 2D version of the TOX_REPR model.

    Performance of the 2D version of the TOX_REPR model.

  • Models of Environmental Toxicity

    The bioconcentration factor, BCF, has been defined as the ratio of the chemical concentration in biota to that in water at steady state, as a result of absorption via the respiratory surface (Hamelink; 1977). Environmentally, the BCF describes the accumulation of pollutants partitioning from the aqueous phase into an organic phase (typically fish) and does not include uptake due to diet. The BCF has no units, as seen by the equation below:

    BCF = [Concentration in organism] / [Concentration in environment]


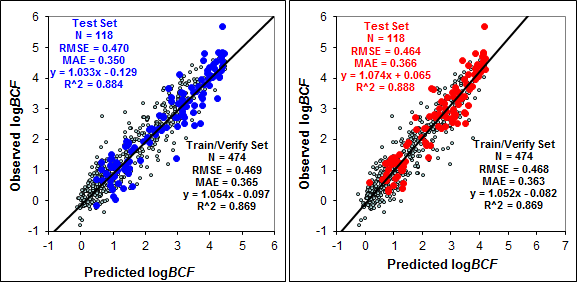
    Here, the BCF and steady-state BCF are synonymous with steady-state occurring after the organism has been exposed for a sufficient length of time such that the ratio does not change substantially. Environmentally, there may be concern if a significant amount of a substance is concentrated in a local environment (through dumping, spillage, production, etc.) and the BCF is significantly greater than 1. The European Union’s REACH framework indicates BCF measurements for pollutant/chemical production or import of greater than 100 tons per year, as the BCF can be useful for classification and labeling, prioritization, and safety assessment purposes. In particular it has been suggested that the BCF could be used in a first tier risk assessment of secondary poisoning in wildlife and humans though dietary exposure. The Organization for Economic Co-operation and Development (OECD) 305 guideline specifies the preferred experimental conditions for BCF testing. The number of fish suggested for the test ranges from 132 to 240 with each test being performed from 44 to 116 days. A literature data set of 592 substances with experimentally measured data points was compiled and logBCF was modeled using ANNE methodology. 20% of the entire data set was set aside for the test set and in both 2D and 3D cases.

    Understanding biodegradation of chemicals in the environment is becoming an increasing concern. There are several assays available to classify if a compound is biodegradable. (Cheng; 2012) provided data and references for a set of 1604 compounds that have either undergone the Japanese MITI (14 day protocol) or the OECD 301C (28 day protocol). The compound of interest is mixed with sludge from several different geographical locations and then oxygen consumption is measured for the period of time based on the protocol. Biological oxygen demand (BOD) and percent biodegradation are calculated via the following equations, where ThOD represents the theoretical oxygen demand. Both BOD and ThOD are given in units of [mg O2 / mg test substance].

    BOD = ([mg O2 uptake by test substance] - [mg O2 uptake by blank]) / [mg of test substance in the vessel]
    % Biodegradation = 100 * BOD / ThOD


    A compound is considered readily biodegradable if the BOD is greater than or equal to 60% of the ThOD, otherwise that compound is considered non-readily biodegradable.

    After removing all metal containing compounds and maintaining only a single stereoisomer or tautomer of duplicated compounds, 1581 compounds remained. Approximately 22% of the data set was set aside as an external test set with the remaining compounds used as the training pool from which an artificial neural network ensemble was created with sensitivity and specificity above 82% on both the training pool and external data set.

    Beginning in 1995, the Mid-Continent Ecology Division of the US Environmental Protection Agency tested a set of industrial compounds for lethal effects on Pimephales promelas, the fathead minnow. The resulting database was used for internal efforts to develop a structure-activity relationship model and was also made available for public use under the EPA’s DSSTox program. This published data was the basis for training ADMET Predictor’s fathead minnow acute toxicity model, called TOX_FHM.

    The result that appears in the TOX_FHM column is the predicted concentration in units of mg/L of a given compound that will kill 50 percent of a population of minnows after an exposure time of 96 hours.

    Although relatively few pharmaceutical compounds appeared in the training set of this model, those molecules that do fall into its chemical space still have a high predictive confidence. The model is best suited to aromatic, amine-rich, halogenated, or non-polar compounds.

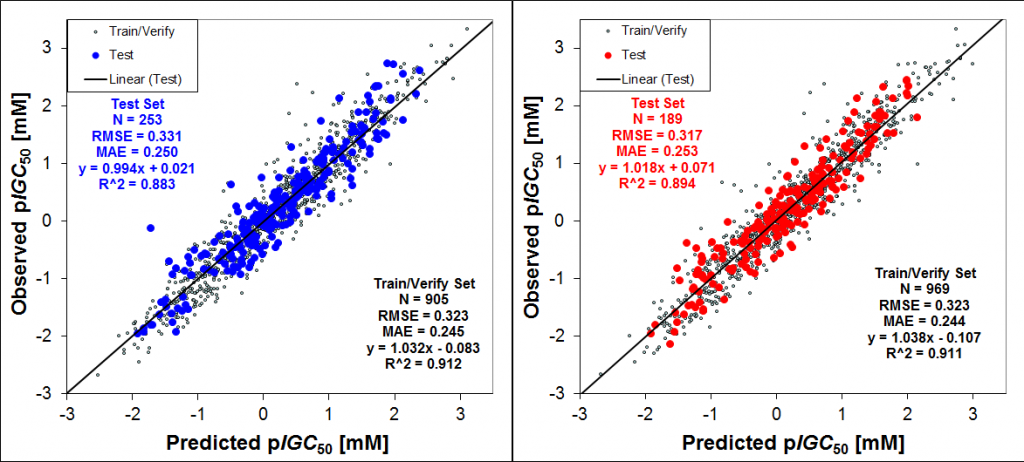
    Another toxicity assay has been developed at the College of Veterinary Medicine at the University of Tennessee in the laboratory of Prof. T.W. Schultz (Schultz 1997). The assay measures the concentration of toxicant needed to inhibit 50% growth (IGC50) in the protozoan species, Tetrahymena pyriformis, after approximately 40 hours exposure (8-9 cell cycles in the control group) at 27°C. Publicly available data from this assay was employed in a recent publication to assess various QSAR modeling approaches by different research groups (Zhu et al, 2008). In that study, the dataset was partitioned into a training set (provided to each of the modeling groups) and two test sets (the second test set being discovered after the study was initiated). Using the same partitioning, we matched the best level of performance (in both test sets) as reported among individual models of that study. By repartitioning the full dataset into training/verification and test sets using a Kohonen map, further improvement in performance was achieved as shown in figure below. The output is pIGC50 where the IGC50 part is in units of mmol/L.

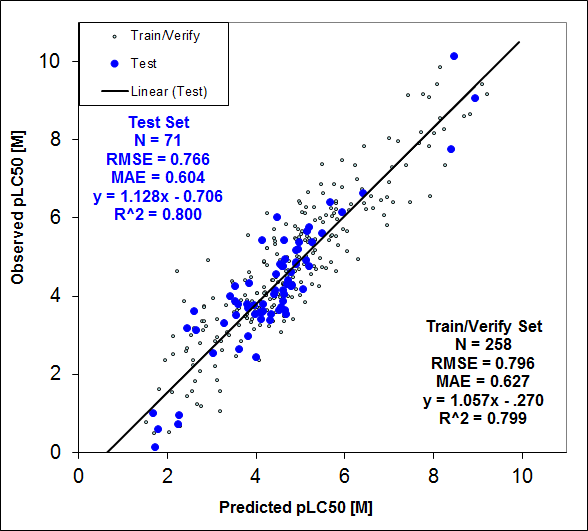
    The next aquatic toxicity model, TOX_DM, is based on lethal concentration (in mg/L) that results in the death of 50% of Daphnia magna (water fleas) after 48 hours. The data for this study was obtained from the EPA’s website with the endpoint given as pLC50 along with the guidelines as to how it was obtained from the EPA’s ECOTOX database. Although the model was developed in molar units (as the graph below indicates) to eliminate explicit molecular weight dependence, the model output is converted back to the LC50 expressed in units of mg/L. The model’s performance reflects the quality of experimental data used to build it. It should be noted that approximately 10% of this data set was composed of pLC50 values derived from measurements varying more than one log unit, which is a common problem with biological data obtained from different sources. On the other hand, the Spearman’s rank correlation coefficient is 0.88 for the training/verify and test sets, which implies that the artifact caused by the disparity of measurements may not be significantly impacting the qualitative side of TOX_DM model.

    ADMET Predictor 2D and 3D TOX_ATTP Model Validation


    Observed pLC50 vs. 2D TOX_DM model predictions.


    ADMET Predictor 2D and 3D TOX_BCF Model Validation


    ADMET Predictor 2D TOX_BIODEG Model Validation


    ADMET Predictor 2D and 3D TOX_FHM Model Validation

  • References

    Blair RM, Fang H, Branham WS, Hass BS, Dial SL, Moland CL, Tong W, Shi L, Perkins RG, and Sheehan DM. “The estrogen receptor relative binding affinities of 188 natural and xenochemicals: Structural diversity of ligands.” Toxicol Sci. 2000; 54:138-153.

    Branham WS, Dial SL, Moland CL, Hass BS, Blair RM, Fang H, Shi L, Tong W, Perkins RG, and Sheehan DM. “Binding of phytoestrogens and mycoestrogens to the rat uterine estrogen receptor.” J Nutr. 2002; 134:658-664.

    Cheng F, et al. J Chem Inf Model. 2012; 52(3):655-669.

    Fang H, Tong W, Shi LM, Blair R, Perkins R, Branham W, Hass BS, Xie Q, Dial SL, Moland CL, and Sheehan DM. “Structure-activity relationships for a large diverse set of natural, synthetic, and environmental estrogens.” Chem Res Tox. 2001; 14:280-294.

    Fang H, Tong W, Branham WS, Moland CL, Dial SL, Hong H, Xie Q, Perkins R, Owens W, Sheehan DM. “Study of 202 Natural, Synthetic, and Environmental Chemicals for Binding to the Androgen Receptor.” Chem Res Toxicol. 2003; 16: 1338-1358.

    Hamelink JL. “Current bioconcentration test methods and theory.” in Aquatic Toxicology and Hazard Evaluation. Eds. Mayer FL and Hamelink JL. West Conshohocken, PA ASTM STP, 1977.

    Matthews EJ, Kruhlak NL, Benz RD and Contrera JF “Assessment of the health effects of chemicals in humans: I. QSAR estimation of the maximum recommended therapeutic dose (MRTD) and no effect level (NOEL) of organic chemicals based on clinical trial data.” Current Drug Discovery Technologies 2004; 1:1

    Schultz, TW, “TETRATOX: Tetrahymena pyriformis population growth impairment endpoint – A surrogate for fish lethality.” Toxicol Methods. 1997; 7:289-309; https://www.vet.utk.edu/TETRATOX/

    Vinggaard AM, Niemelä J, Wedebye EB, Jensen GE. “Screening of 397 Chemicals and Development of a Quantitative Structure – Activity Relationship Model for Androgen Receptor Antagonism.” Chem Res Toxicol. 2008; 21: 813-823.

    Zhu H, Tropsha A, Fourches D, Varnek A, Papa E, Gramatica P, Öberg T, Dao P, Cherkasov A, Tetko IV, “Combinatorial QSAR Modeling of Chemical Toxicants Tested Against Tetrahymena pyriformis.” J Chem Inf Model. 2008; 48:766-784.

03. RESOURCES
Explore Resources