Two great programs, ADMET Predictor® and MedChem Studio™ have now been combined into one wonderful graphical user interface! The MedChem Studio Module, described below, contains tools for data visualization, compound clustering, high throughput screening analysis, lead identification and prioritization, de novo design, scaffold hopping, lead optimization, and much more!
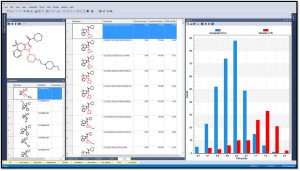
Generate fingerprints (keys) using different methods including Extended-Connectivity Fingerprints (ECFPs) in order to elucidate SAR and visualize structure alerts. One can easily identify keys that most correlate with a compound property. The image below shows that the 115 molecules containing the highlighted fragment have higher PI3K pIC50 values.
-
Intuitive Class Generation
MedChem Studio’s class generation technology reproduces a chemist’s reasoning by automatically organizing molecules into chemical families based on shared scaffolds:
- Uses maximum common substructures (MCSs) rather than fingerprints, so results are chemically intuitive
- Generates scaffolds from the data rather than reading them from a pre-defined list, so novel structural motifs can be discovered
- Provides an ideal starting point for local QSAR generation, molecule design, and other analysis tasks
- User-defined scaffolds can also be used to generate classes
- “Frameworks” class generation option similar to the Murcko assemblies method
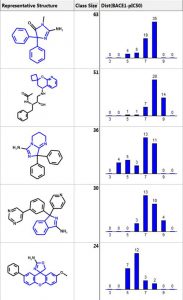
Below are the five largest classes generated using “Frameworks” on a set of 884 BACE1 inhibitors. The scaffold is highlighted in blue and the second column is the number of compounds in the class. The third column is a distribution plot of the pIC50 (-logIC50) for the compounds in each class.
-
R Table Generation
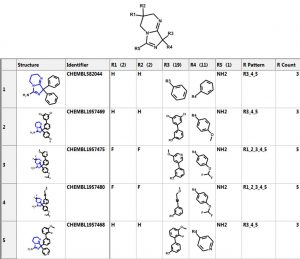
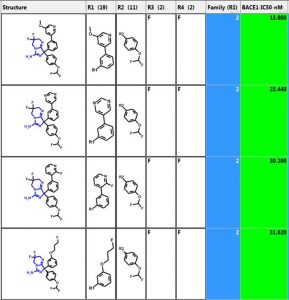
Let’s investigate the scaffold in the 3rd row above. One can simply click on the “R Tables” tab to automatically generate the scaffold and table below. A column is created for each R Group. The number in parenthesis is the number of substituents in each position. There is only one substituent (NH2) at the R5 position.
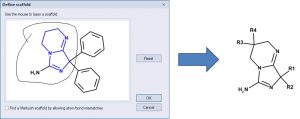
One can define a scaffold using the lasso tool to circle (below) the atoms that define the scaffold. Now the NH2 group is part of the scaffold so there are only 4 substituents.
- Family Column
-
R Group Analyzer
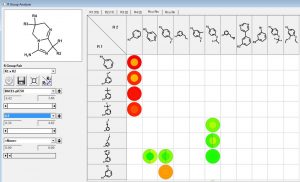
We can investigate the R1 and R2 substituents using the R Group Analyzer shown below. Here the rows are the R1 substituents and the columns are the R2 sidechains. Empty cells in the matrix represent unexplored chemistry space. The outer circle in the “circle plots” are colored by BACE1-pIC50 and the inner circles are colored by ligand lipophilic indices.
-
Similarity Searching and Diverse Subset Generation
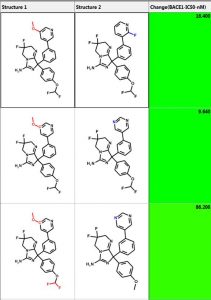
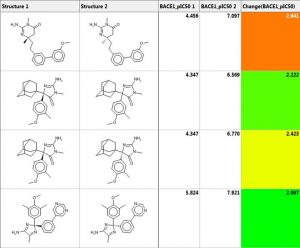
One can perform similarity searching and analyze the hits in the “Pairs” tab. The query and hit molecule are aligned by their common substructure and the differences are highlighted in red and blue. A few examples are shown below. The third column is the difference in IC50 values. One can also generate a diverse set of compounds using the MedChem Studio Module of ADMET Predictor.
-
MedChem Studio Formatted Databases
One can also create a database (library) of compounds that can be searched very quickly. The library can be screened by structure, text, or similarity. The similarity searches can be performed on a single molecule or a file of structures.
R Table Explosion and Combinatorial Chemistry Library Enumeration
Empty cells in an R Group analysis represent unexplored chemistry space. R Table explosion combines every substituent at each position with every substituent at all other positions. However, the user can ignore substituents at certain positions so that they are not part of the enumeration.
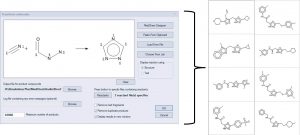
Combinatorial chemistry libraries can be enumerated by defining a reaction, mapping the atoms in the products to their corresponding atoms in the reactants , and specifying a list of reactants. The example below illustrates the reaction of nitriles with acyl hydrazines to form 1,3,4 triazoles. A few of the products are displayed on the right.
-
Matched molecular pair analysis (MMPA)
Matched molecular pair analysis can be used to identify activity cliffs in a data set or to perform an analysis to identify and possibly exploit structural trends in property values:
- A MMP is a pair of molecules with a small, specific structural transformation
- MMP analysis (MMPA) is the automated identification of matched molecular pairs and analysis of the change in property values between the pairs
- The average change in property value is the expected size of the property value when the transformation is applied to another molecule
- MedChem Studio automatically creates a SMIRKS string that encodes each transformation rule
- These rules can be added to our “Combinatorial Transform…” feature in order to generate novel molecules potentially containing the desired change in property value


