This blog post continues our ongoing series on leveraging quantitative systems pharmacology (QSP) to enhance drug development. Our first post, “Targeting Complement to Reduce Disease Activity: Quantitative Systems Pharmacology (QSP) to Enhance Efficient Drug Development,” laid the foundation by discussing the theoretical underpinnings and benefits of QSP, along with an overview of our complement QSP model. The second post, “Targeting Complement to Reduce Disease Activity: Challenges and Opportunities in the Publicly Available Data,” delved into the intricacies and hurdles faced when utilizing publicly available data for QSP models. In this third installment, we illustrate the representation of a drug within a complement QSP model, using eculizumab, an anti-C5 monoclonal antibody, as our example.
The Intersection of Disease Biochemistry, Drug Exposure, and Drug Mechanism of Action
Representing a drug in a QSP model necessitates a holistic approach that encompasses relevant disease biochemistry, drug exposure, and mechanism of action. The components of the representation are broken down below:
1. Representation of Disease and Interpatient Variability in Simulated Populations
Most frequently, we start with a representation of healthy and extend to disease populations (you can read our discussion on representing the biochemistry for a normal healthy volunteer [NHV] population).
In paroxysmal nocturnal hemoglobinuria (PNH), complement over-activity is due to deficiencies in CD55 and CD59 regulation 1. For the current model scope, CD55 deficiency is represented, which leads to enhanced stability of C3 and C5 convertases and increased complement activity. Similar to the simulated NHV population, the PNH population was qualified based on comparison of simulated complement analytes against published clinical PNH data2,3.
In rheumatoid arthritis (RA), complement over-activity is postulated to be via an excess of autoantibodies, leading to classical complement pathway activation which in turn activates the alternative pathway4. The classical complement pathway is simply represented by including classical C3 and C5 convertases4–7. As described above, the simulated RA population was qualified based on comparison of simulated complement analytes against published clinical RA data8,9.
2. Dynamic Exposure
A second key component is the accurate representation of drug exposure in the body. Importantly, the representation could be static or dynamic and could include tissue concentrations at key sites of disease activity. Commonly, the representation of drug exposure is achieved through a pharmacokinetic (PK) model, which could include compartmental or physiologically-based PK (PBPK) models. For eculizumab, a two-compartment PK model was developed using a variety of data sources:
- Plasma exposure reported following single-dose administration in NHVs and RA patients10–12
- Plasma exposure reported following multi-dose administration in patients with PNH2
The PK model was fit to the available dynamic datasets (Figure 1, Figure 2). Summary PK statistics available from RA patients12 were split into optimization and validation sets (Table 1). While the available data were not extensive, the ability to hold a dataset out and test the model’s ability to reproduce that data (i.e., validation) provided additional confidence that the model could reasonably predict eculizumab exposure for the evaluation of eculizumab efficacy in RA patients (below).
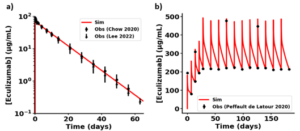
Figure 1. Simulation results for optimization of two-compartment Monolix model of ECU. (a) Single dose 300 mg ECU IV infusion data in NHVs10,11. (b) Repeat dosing ECU IV infusion data in PNH patients2. Patients received 600mg QW for 4 weeks during the induction phase, followed by 900mg Q2W in the maintenance phase. Published data are indicated in black symbols. Simulation results are in red.
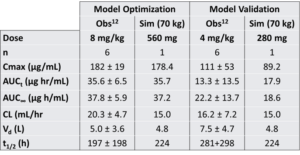
Table 1. Comparison of pharmacokinetic characteristics for single dose ECU in RA patients12: 8 mg/kg (optimization) and 4 mg/kg (validation).
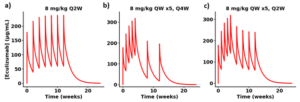
Figure 2. Predicted plasma exposure following repeat eculizumab dosing in RA patients as seen in an ACR poster13. RA patients were treated for 12 weeks according to the following: (a) 8 mg/kg Q2W, (b) 8 mg/kg QW x5, Q4W, and (c) 8 mg/kg QW x5, Q2W. No PK data were identified for this study. Simulation assumes 70 kg individual.
3. Linking Drug Exposure to Mechanism of Action
Eculizumab functions by binding to complement C5, thereby depleting free C5 and inhibiting the complement terminal pathway. This mechanism of action was optimized within the model to reflect the dynamic interaction between eculizumab and C5. The multi-dose eculizumab data in PNH patients3 were particularly critical in this optimization, as they demonstrated the time- and dosing-dependent reduction in free C5 levels (Figure 3).
C5 is critical to complement activity as a substrate for C5 convertase, leading to C5b-9 terminal complement complexes capable of mediating cell lysis14. Complement-mediated erythrocyte lysis is a clinical endpoint, measurable as hemolysis. In the case of eculizumab, single-dose exposure in RA patients was fit to a dose- and time-dependent reduction in hemolysis (Figure 412) using a simulated population.
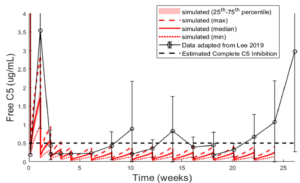
Figure 3. ECU representation optimized to free C5 during clinical dose administered to treatment-naïve PNH simulated population3.
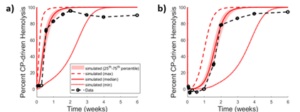
Figure 4. Observed12 vs optimized dosing protocol-dependent CP response to ECU in RA patients and RA SimPops. Results following (a) 4 mg/kg and (b) 8 mg/kg. Reported data are in black symbols and lines; simulation results are in red.
Predicting Eculizumab Efficacy for a Hold-Out Dataset
Ideally, one tries to leave a dataset aside for testing the representation. In this case, a study was conducted with N=209 RA patients in which…
- Group A received placebo
- Group B received 8 mg/kg eculizumab every 2 weeks
- Group C received 8 mg/kg eculizumab weekly for 5 weeks, followed by a dose every 4 weeks
- Group D received 8 mg/kg eculizumab weekly for 5 weeks, followed by a dose every 2 weeks
Reduced hemolytic activity was reported for Groups B, C, and D13. These same protocols were simulated using the eculizumab representation. Simulations successfully predicted reductions in hemolysis following repeat dosing in RA patients (Figure 5), validating its utility in clinical settings.

Figure 5. Observed13 vs simulated dosing protocol-dependent CP response to ECU in RA patients and RA SimPops. Results following (a) 8 mg/kg Q2W dosing, (b) 8 mg/kg QW dosing for five weeks, then Q4W dosing, and (c) 8 mg/kg QW dosing for five weeks, then Q2W dosing. Reported data are in black symbols and lines; simulation results are in red.
In conclusion, eculizumab and complement C5 are reasonably represented in the complement QSP model, as demonstrated through matching calibration data and subsequent application to a dataset held out during optimization. Beyond eculizumab, the QSP model includes additional drugs with different mechanisms of action that serve to provide that same assurance that the modeled biochemistry approximates the dynamic clinical response for other aspects of the complement cascade. For a novel compound, hemolysis could be used as a clinical endpoint, such that compound representation could be accomplished with exposure and mechanism of action alone. Alternatively, additional clinical endpoints could be incorporated using a similar approach as described above. This demonstrates the capability of the QSP model to both represent known drugs and their clinical response and serve as an expandable platform as potential targets and disease knowledge expand.
References
- Schmidt, C. Q., Schrezenmeier, H. & Kavanagh, D. Complement and the prothrombotic state. Blood 139, 1954–1972 (2022).
- Peffault de Latour, R. et al. Pharmacokinetic and pharmacodynamic effects of ravulizumab and eculizumab on complement component 5 in adults with paroxysmal nocturnal haemoglobinuria: results of two phase 3 randomised, multicentre studies. Br J Haematol 191, 476–485 (2020).
- Lee, J. W. et al. Ravulizumab (ALXN1210) vs eculizumab in adult patients with PNH naive to complement inhibitors: the 301 study. Blood 133, 530–539 (2019).
- Trouw, L. A., Pickering, M. C. & Blom, A. M. The complement system as a potential therapeutic target in rheumatic disease. Nat Rev Rheumatol 13, 538–547 (2017).
- Holers, V. M. & Banda, N. K. Complement in the Initiation and Evolution of Rheumatoid Arthritis. Front Immunol 9, 1057 (2018).
- Di Muzio, G. et al. Complement system and rheumatoid arthritis: relationships with autoantibodies, serological, clinical features, and anti-TNF treatment. Int J Immunopathol Pharmacol 24, 357–366 (2011).
- Familian, A. et al. Infliximab treatment reduces complement activation in patients with rheumatoid arthritis. Ann Rheum Dis 64, 1003–1008 (2005).
- Bemis, E. A. et al. Complement and its environmental determinants in the progression of human rheumatoid arthritis. Mol Immunol 112, 256–265 (2019).
- Kajdacsy-Balla, A., Doi, E. M. & Bagasra, O. Activation of factor B of the alternative pathway of complement. Assessment by rocket immunoelectrophoresis. Am J Clin Pathol 88, 66–73 (1987).
- Chow, V., Pan, J., Chien, D., Mytych, D. T. & Hanes, V. A randomized, double-blind, single-dose, three-arm, parallel group study to determine pharmacokinetic similarity of ABP 959 and eculizumab (Soliris® ) in healthy male subjects. Eur J Haematol 105, 66–74 (2020).
- Lee, H. A., Jang, H., Jeong, D., Kim, Y. & Fuhr, R. A randomized, double-blind, three-arm, parallel group, single-dose phase I study to evaluate the pharmacokinetic similarity between SB12 (a proposed eculizumab biosimilar) and eculizumab (Soliris) in healthy subjects. Int J Clin Pharmacol Ther 60, 269–279 (2022).
- Drug Approval Package: Soliris (Eculizumab) NDA #125166. at <https://www.accessdata.fda.gov/drugsatfda_docs/nda/2007/125166s0000TOC.cfm>
- Kivitz, A., Burch, F., Birbara, C., Rollins, S. & Tesser, J. Pharmacokinetics (PK) and Pharmacodynamics (PD) of the Humanize Anti-C5 Antibody h56GL.1 in Patients with Rheumatoid Arthritis. Arthrithis & Rheumatism 2001 Annual Scientific Meeting Abstracts 166–276 (2001).
- Pouw, R. B. & Ricklin, D. Tipping the balance: intricate roles of the complement system in disease and therapy. Semin Immunopathol 43, 757–771 (2021).
By Lara Clemens, Zackary Kenz, Lisl Shoda
